Definition of stroke based on the World Health Organization(WHO), is a collection of symptoms and clinical signs due to focal and global brain function disorders that occur suddenly, develop rapidly with symptoms that last for 24 hours or more or cause death, without other obvious causes other than vascular. Stroke is one health problem that needs special attention. Nerve function disorder in stroke cause symptoms, including paralysis of the face or limbs, speech disorder, unclear speech, changes in consciousness, impaired vision, other symptoms. (Riskesdas, 2013). The prevalence of stroke in a group diagnosed by health personnel and those who have a history of symptoms increases with age, the highest at age ≥75 years (43.1 ‰) and (67.0 ‰)
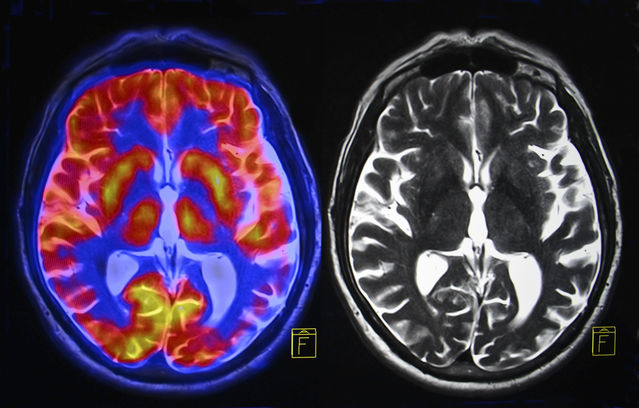
EEG and Continuous EEG (CEEG) have been developed to detect acute ischemic cerebral during carotid artery surgery. Kenneth G. Jordan (Jordan, 2004) suggests that electroencephalography can confirm or detect acute ischemic strokes as indicated by slowing waves on electroencephalogram (EEG) signal spectra (appearing delta signal activity) and reduced cerebral volume. EEG changes when there is a decrease in blood flow in the brain, such as reduced or rapid loss of frequency (beta and alpha, sometimes including spindle sleep) and wave deceleration appears (theta and delta). Ischemia can be seen in the reversal phase of EEG even though anatomical imaging such as MRI remains normal. When blood flow in the brain decreases, frequency flattening occurs in parts of the brain that experience neuronal death (infarction). The ability of EEG to detect ischemia at an early stage with a continuous procedure is the basis for monitoring EEG in patients at high risk for ischemia (Hirsch & Brenner, 2010). Electroencephalographs or electroencephalographs carried out continuously are the most sensitive neurodiagnostic tools for detecting acute cerebral ischemia (Jordan, 2004), although until now it has not been able to replace the presence of a Computed Tomography Scan (CT scan) or Magnetic resonance imaging (MRI), but it has advantages in terms of lower operational costs.
Brain Symmetry Index (BSI) is one of the parameters used in EEG analysis that is most often used and has proven useful in assessing the level of symmetry of the hemisphere. Cecile de Vos’s research (Vos, Maarseveen, Brouwers, & Putten, 2008) had shown a positive correlation between BSI and clinical assessment scorers in acute ischemic stroke patients. National Institutes of Health Stroke Scale (NIHSS) and Xiyan Xin research (Xin et al. , 2012) showed a positive correlation between BSI and clinical assessment scores in acute hemorrhagic stroke patients, NIHSS, Glasgow Coma Scale (GCS) and Acute Physiology and Chronic Health Evaluation II (APACHE II). Michael JAM van Putten and Tavy (Van Putten & Tavy, 2004) used the BSI method to monitor hemispheres in stroke patients using quantitative electroencephalography and the results showed a correlation between BSI and NIHSS.
Based on the characteristics shown by the acute myocardial stroke in the EEG signal, the emergence of slow waves and wave asymmetry in the hemisphere, the study used values of Delta / Alpha Ratio (DAR), ( Delta + Theta ) / ( Alpha + Beta ) Ratio (DTABR) and Brain Symmetry Index (BSI) as an ELM input feature value obtained by Wavelet transformation (Daubechies 4) and Welch method to identify acute ischemic stroke. The results of this study obtained accuracy values above 85% with sensitivity values above 86%. ELM was chosen because it requires shorter training time and has higher accuracy compared to other algorithms such as Backpropagation and Support Vector Machines(SVM) in classifying EEG signals (G. -B. Huang, Zhu, & Siew, 2006).
The data of this study are EEG data of normal patients and acute ischemic stroke patients obtained from the National Brain Center Hospital, Jakarta in the pdf format (European Data Format). Patient data is equipped with the results of CT scans as a comparison of EEG analysis. The electrodes used are 32 channels with an international laying system of 10-20. EEG recording was done for approximately 30 minutes in a conscious state or not sleeping using EEG Biologic and Natus devices with sample frequencies of 256 Hz and 512 Hz.
Author: Osmalina Nur Rahma
Details of the research available at: